¶ 05.1 Forecasting Components.
¶ KubeFlow Pipelines
The core of the Forecasting Service is reflected in three KubeFlow Pipelines:
- Train
- Forecast
- Monitor
There is additional information found in the README files of the Forecasting.
Training Pipeline
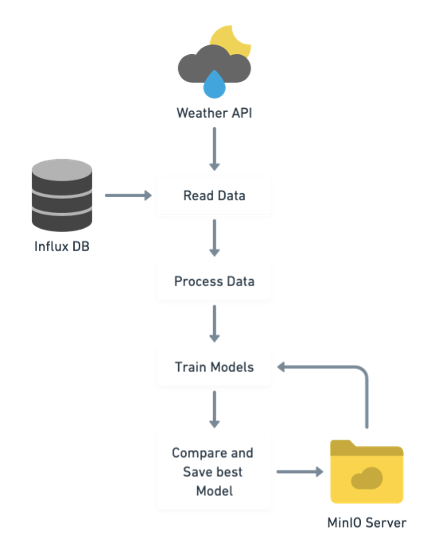
This pipeline takes care of training the time series forecasting model using the available data in the time series database (InfluxDB) and external data necessary for training (e.g. weather data). This pipeline only trains the model (no forecast is generated) and saves the model to the InfluxDB as a result of a run.
The data is read from InfluxDB and weather data is collected using a third-party weather API to improve model performance. The third API used is OpenMeteo (for more information check the source webpage: https://open-meteo.com/). Then, the data is preprocessed to clean and format accordingly (for more information on this process check the README files associated to the KubeFlow Pipelines). In the next step, based on different pre-defined algorithms several models are trained and compared with pre-existing ones to choose the best suited one. All models are saved back into the MinIO server but only one of them, the best one, given the metric chosen, is set to be the main model for forecasting.
There are three models trained:
- Prophet: According to its own description, “Prophet is a procedure for forecasting time series data based on an additive model where non-linear trends are fit with yearly, weekly, and daily seasonality, plus holiday effects”. This makes for an effective while fast to train type of model. Information about prophet.
- LSTM. Using the implementation in the darts python package, LSTM or Long Short Term Memory is a type of Recurrent Neural Network which is commonly used in time series forecasting. The darts package is an aggregator of different methodologies.
- Transformers: Adaptation of the transformers model, very popular in text AI, implemented in the same darts package.
These are the included models in the package. Using the arguments of the main function (See Forecasting), it is possible to use the pipeline to train just one model, for instance by having the argument forecast_models as [prophet, lstm]. That way only the prophet and lstm models will be trained.
It is possible to use other algorithms by using the FAST System. This allows to introduce new algorithms into the RENergetic System.
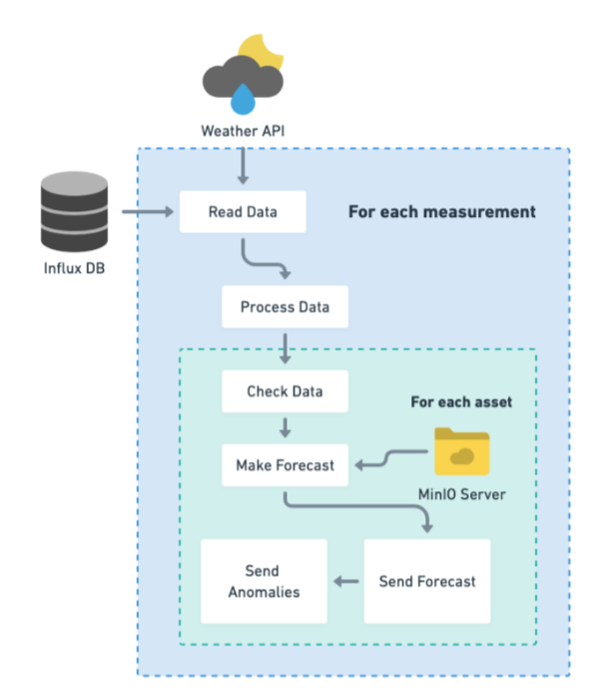
Forecast Pipeline
This pipeline makes the predictions for any asset for which there exists a model already trained. This pipeline does not train any AI models, nor validate the models themselves, just makes the forecast, in case there is enough data to make the forecast. This pipeline is thought to be executed in recurrent runs.
This pipeline functions as a repetitive call to an API that sends new forecasts to the InfluxDB. The only check that is done is in the step Check Data to make sure that there are values close enough to today to make the forecast. There is a threshold value (set in the parameters of the function) that refers to the percentage of missing values in the last 7 days. If for instance, the threshold is 20% that means that if in the last 7 days there are more than 20% of missing values for the time schedule then the forecast will not be made.
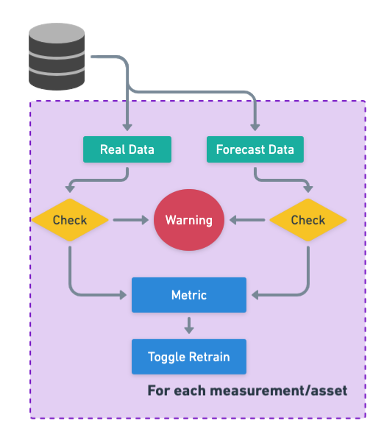
Monitor Pipeline
This pipeline checks the quality of the forecasts made in the system. If the results do not meet the quality standards of the user for the measurement/asset, the model is retrained using all available data.
There are two checks similar to the ones happening in the Forecast Pipeline (availability of data) and then there is a metric check. For this pipeline there is an argument that sets the metric to be check, being the ones available as part of the system:
- Root Mean Square Error (RMSE)
- R2
- Mean Absolute Error (MAE)
It is possible to introduce new metrics through the Surveil class in the FAST System.
If the metrics for forecast in the last 7 days falls below the standard set in the arguments of the pipeline, then a retrain of the model will be toggled in the next cycle.
¶ MinIO Server
The MinIO is an S3 Storage Server where most of the products of the Pipelines are saved.
Models
The physical object of the model is saved in the minio server in a bucket with the name scheme as: "pilot_name"-"measurement"-"asset", for instance: OSR-heat-iceberg, in which all the models for the asset iceberg of OSR and measurement heat are saved. Within the bucket, two objects are saved, the model as an object to then make the predictions and a "asset_config" file in which the basic info of the models is stored, but not for each model but for the pilot/measurement/asset configuration. For instance, in this file we store the name of the model which has to be used for forecasting, the date in which this model was trained, etc.
Everytime a model is trained, the object is saved in the MinIO server, however this does not mean that the configuration is changed. The reason for this is to allow experimentation that does not affect the use of the RENergetic Forecasting.
Obviously all this files may be cleaned after a while. It is recommened to either create a pipeline to manage the versions or a manual change.
Explainability
Other results will also be saved in the MinIO server. The Explainability Feature saves all its results in the same bucket as the forecast models. The naming of the files however will differ and as the custom explainability goes, they may have no structure at all.
¶ Anomaly detection
The anomaly detection for RENergetic works in two steps within the Forecasting Service:
- Processing phase before forecasting
- Threshold values.
These are two independent processes that are both customizable and can be used via the platform.
¶ Processing in forecasting
Before training the forecasting models the training data needs to be preprocessed to improve the accuracy of the predictions. One of the available features to process the time series is an algorithm for anomaly detection. This is a Dynamic Class provided as an example that can be used as both an example to develop other custom processing as well as a tool to use in forecasting.
Once an anomaly (outlier) is detected within the time series, the value is eliminated and substituted for an interpolated value between the non-outlier values. The value itself is not eliminated from the Influx DB, this process is only to improve forecasting and it will directly impact the data itself.
¶ Thresholds
This feature allows to send notifications back to the system if the forecasted values go over or under a set of specific thresholds. For instance, if the forecasted value is forecasted to be over 1 MW, a notification will be sent to the energy manager using the notification system in the RENergetic Platform.